Tokenomics & ecosystem design · modelled as a graph
DevGuild Protocol
A token economy modelled as a queryable graph — not a spreadsheet — then stress-tested by fusing that graph with Monte-Carlo simulation, and put through a scored go/no-go that recommended delaying the launch.
A token economy modelled as a queryable graph, not a spreadsheet — holders, treasuries, incentive loops and governance paths as nodes and edges in Neo4j. We stress-tested it by fusing the graph with Monte-Carlo simulation, then put the whole design through a scored Viability Audit. The recommendation was to delay the token launch until the product earns it — a call worth more than a launch.
The problem
Tokenomics is usually done in a spreadsheet, and spreadsheets are blind to structure:
- A cap-table lists who holds what — but not which holder clusters could collude to cross a governance threshold.
- Emission and vesting tables show flows over time — but not where an incentive loop feeds back into itself.
- Most projects launch a token before product-market fit, then discover the economics don't hold.
- No proof — allocation and reserve invariants are asserted in prose, never machine-checked.
Modelled as a graph, not a spreadsheet
An ecosystem is a graph. We model it as one in Neo4j + Cypher, so questions a cap-table can't answer become a single query.
- Holders, contracts, treasuries, incentive loops, governance paths and agent interactions as first-class nodes and edges.
- Structural questions as traversals — collusion reachability, incentive-loop feedback, and the shortest path from an admin key to protocol funds.
- Invariants machine-checked, not asserted — reserve-backing and compliance-path rules written as zero-row Cypher assertions that fail the build if a holder or a reserve ever breaks them.
- A documented, versioned amendment (RFC-001) to the allocation — change control on the model itself.
Graph ⇄ simulation — the structural risk flows can't see
Simulation models flows over time but is blind to who holds the votes; the graph knows the structure but not the continuous dynamics. We built the bridge between them.
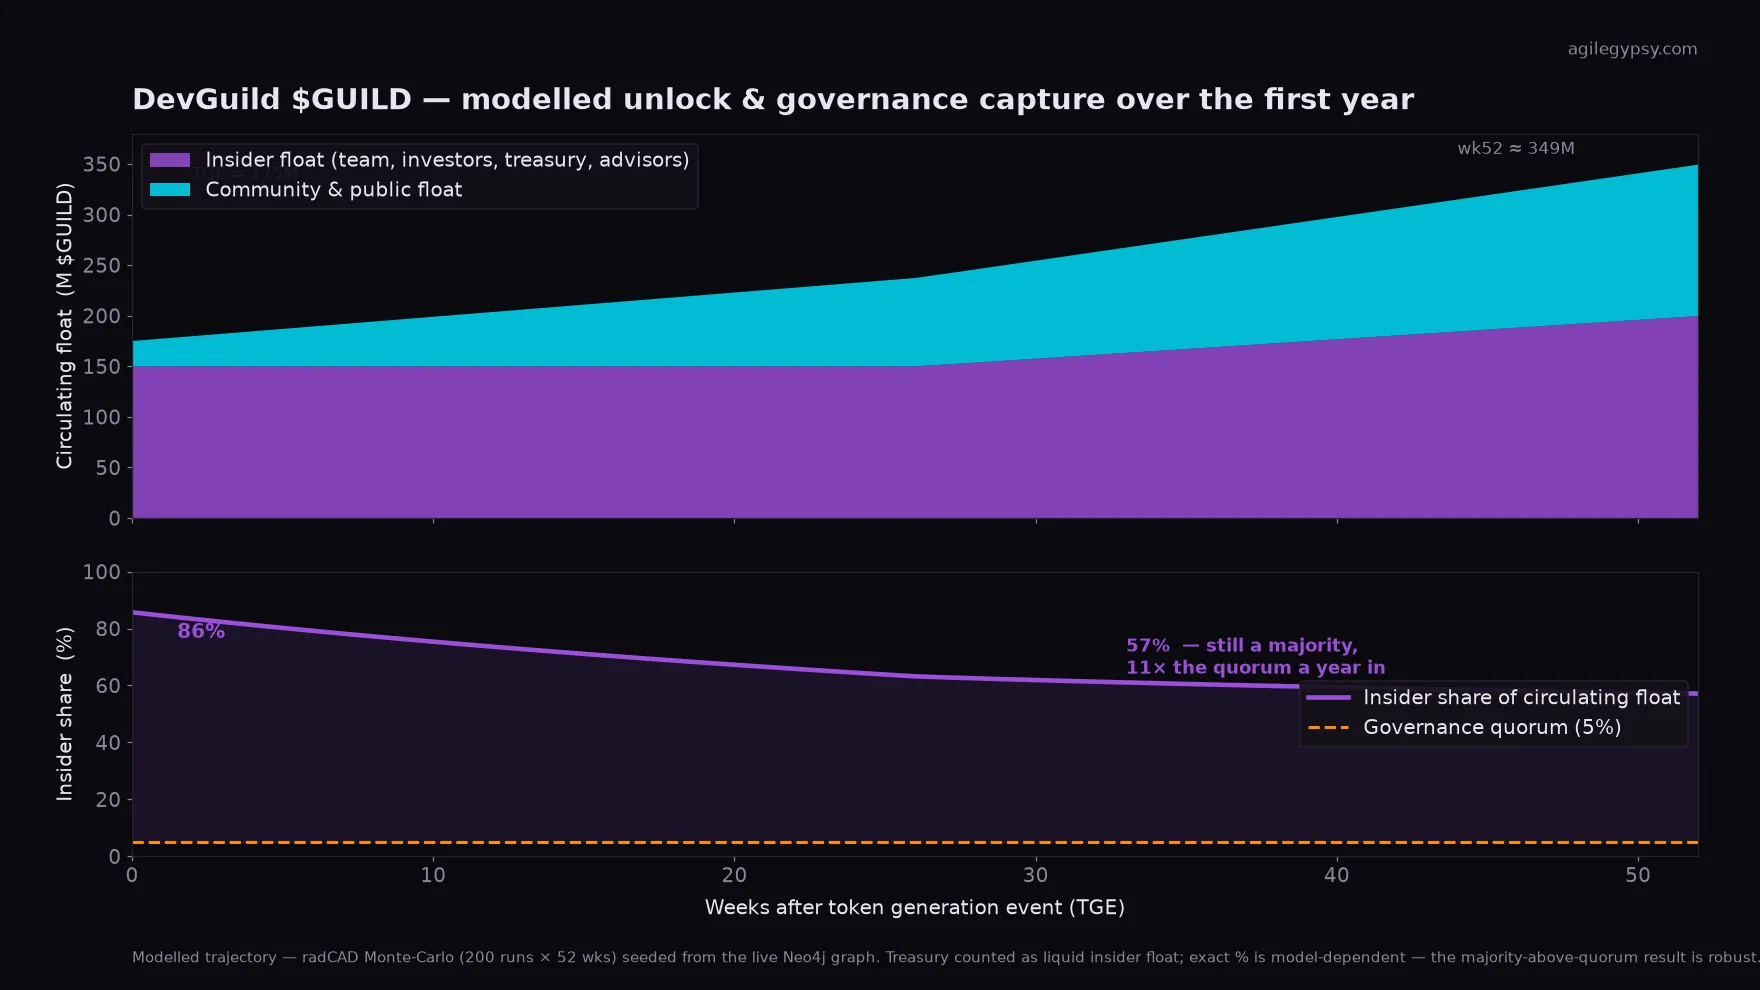
- Structural metrics extracted from the live graph — supply, whale concentration, per-allocation vesting, insider voting weight, quorum — seed a radCAD Monte-Carlo run.
- Circulating supply is driven by the real vesting-unlock curve, not a homogeneous-agent assumption, across 200 runs × 52 weeks.
- Results write back to the graph as a scenario subgraph, so you can ask a structural question about the simulation's own output.
- The finding: a year after launch, insiders would still hold a majority of circulating supply — far above the 5% governance quorum — a capture risk a flow-only model never surfaces.
The Viability Audit — a scored go/no-go
Every consultancy showcases launches. Almost none can show the one they stopped — and a consultant who profits from a launch has no incentive to say no.
- Scored 7.7/10 across build complexity, revenue velocity, moat, GTM and regulatory exposure.
- Recommendation: delay the token six to twelve months and narrow the MVP.
- The TGE gated behind six hard product metrics — real users, real revenue, legal review complete — before a token exists.
- The principle: a token launch should follow product-market fit, not precede it.
Whitepaper & governed delivery
The model sits inside a full delivery pack, not a slide deck.
- A 51-deliverable business-analysis pack — feasibility, business case, architecture, launch readiness.
- Audience-differentiated whitepaper generations — retail, an engineering yellow paper with formal invariants, and an institutional cut.
- Governed with AgilePM discipline — MoSCoW with a Must-cap, RAID on probability × impact, and quality gates the increment must pass.
Built with
Want one built like this?
The engineering behind DevGuild Protocol is available for your system.